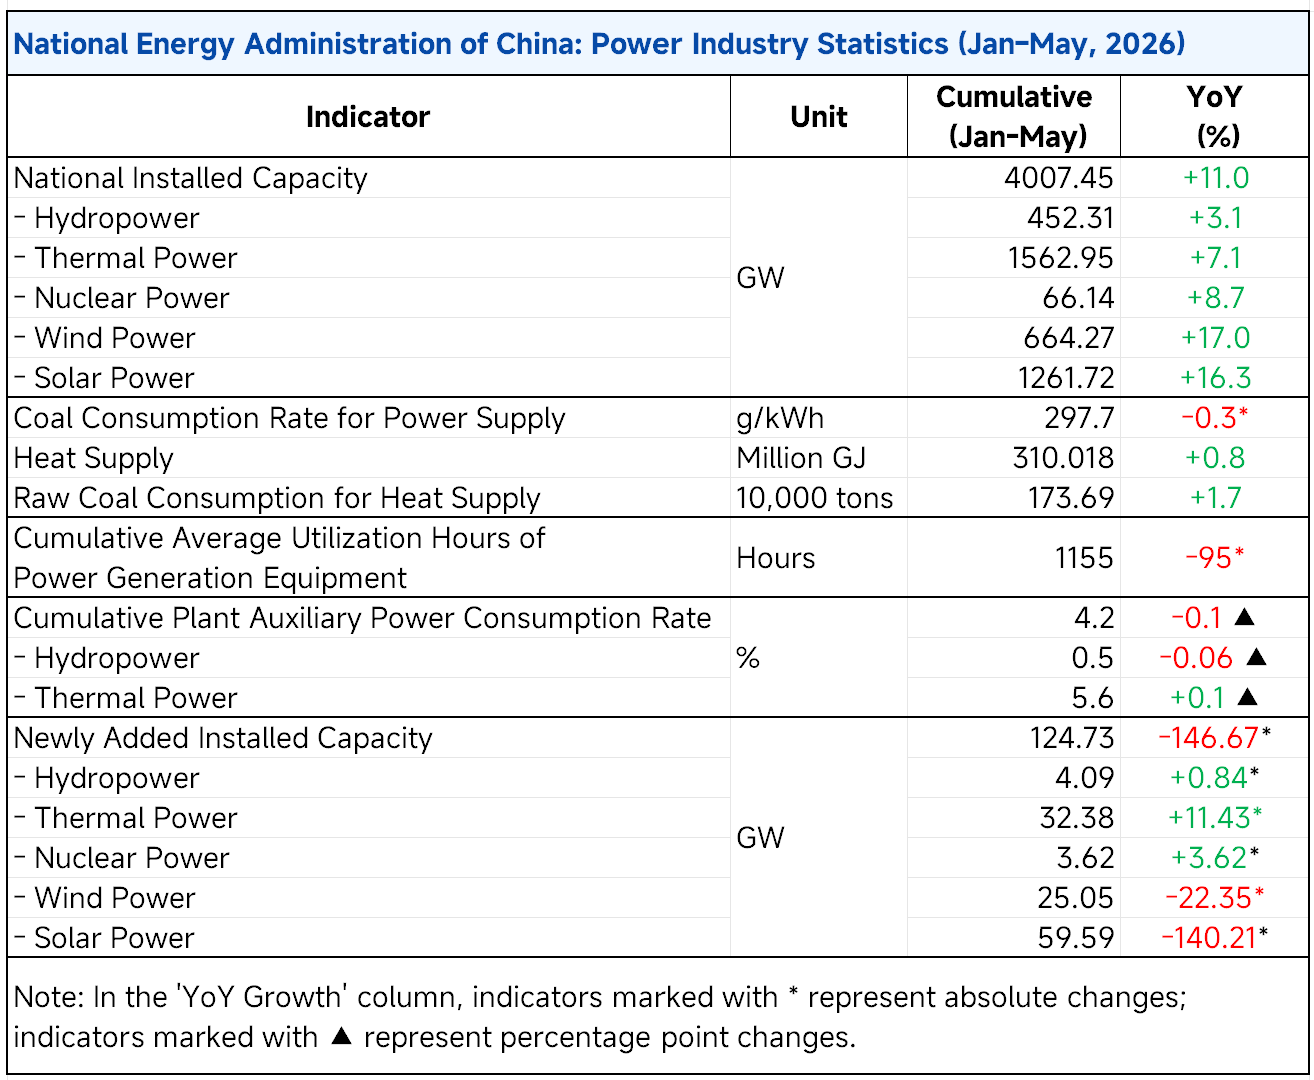
As of the end of May 2026, China's total installed power generation capacity reached 4.01 TW, exceeding the combined installed capacity of the United States, the European Union, India, Japan, and Russia.
Between 2010 and 2025, China's installed power capacity grew at an average annual rate of 9.7%, outperforming the United States (1.7%), the European Union (3.2%), India (7.1%), Japan (2.9%), and Russia (1.2%).
In terms of capacity structure, non-fossil energy has expanded rapidly and become the dominant source of new capacity additions. The share of coal-fired power capacity declined from 61% in 2010 to 32% in May 2026, while the share of non-fossil energy capacity increased from 25% to 62% over the same period.
Since 2010, non-fossil energy has accounted for 74% of all newly installed power capacity. Meanwhile, the share of renewable energy capacity rose from 24% in 2010 to 61% in May 2026, with renewables contributing 73% of total new capacity additions during the period.
Among renewable sources, wind and solar power accounted for 21% and 43% of total new installed capacity additions, respectively, since 2010.
China's pace of capacity expansion has also accelerated significantly. The country surpassed 1 TW of installed power capacity in 2011 (1.06 TW), exceeded 2 TW in 2019 (2.01 TW), crossed 3 TW in April 2024 (3.01 TW), and surpassed 4 TW by the end of May 2026.
The time required to add each additional 1 TW of capacity has shortened dramatically—from eight years for the first increment, to five years for the second, and to approximately two years for the latest increase.




 彭晓��?
彭晓��?