 Edited and Updated by Ethan Ma
July, 7 2025
Market Trends
·Thermal Coal
Demand in the thermal coal market remained mixed this week, with average weekly prices showing both gains and declines compared to the previous period.
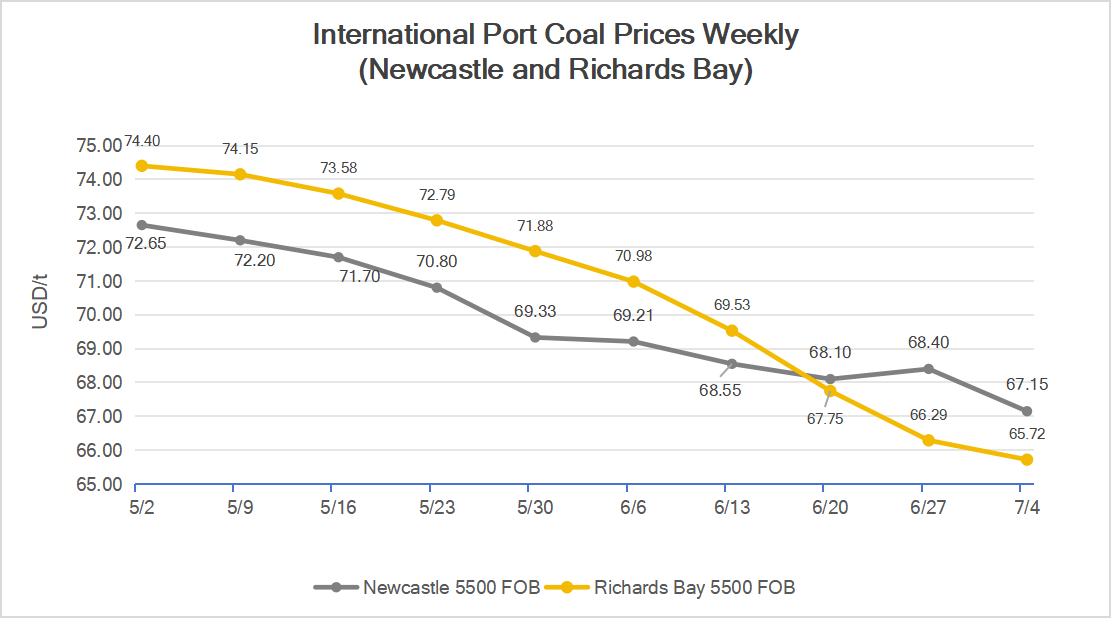
During the week ending July 4, demand remained weak at major ports:
Newcastle:
The weekly average FOB price for 5,500K was $67.15/ton, down $1.25/ton from the previous week, a decline of 1.83%.
Richards Bay:
The weekly average FOB price for 5,500K was $65.72/ton, down $0.57/ton, a decline of 0.86% compared to the prior week.
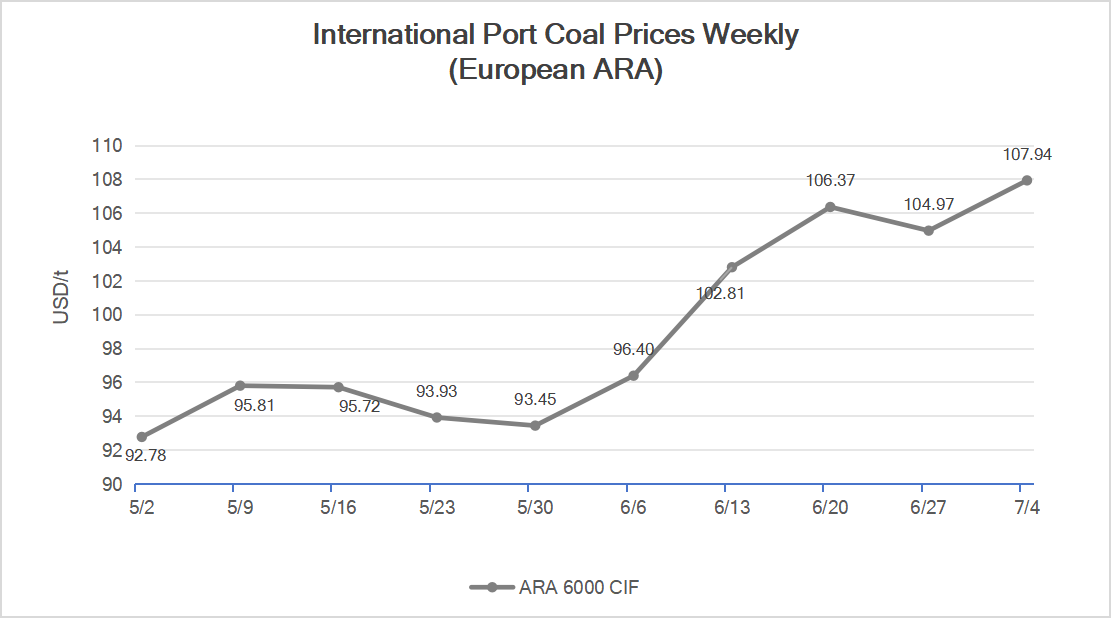
Europe ARA:
The weekly average CIF price for 6,000K was $107.94/ton, up $2.97/ton from the previous week, an increase of 2.83%.
The price rise was supported by increased coal consumption from end-users across Europe.
CCTD China Coal Market Network is one of the most trusted coal industry think tanks in China, providing exclusive and extensive data coverage.
Asia-Pacific Region:
This week, demand for Australian thermal coal from China, Japan, and South Korea remained relatively flat, causing Australian coal prices to stall and slightly retreat. However, interest in low-calorific-value Indonesian thermal coal increased significantly among Chinese end-users, mainly due to favorable pricing. Market participants believe prices are unlikely to fall further.
Rising temperatures across most regions have driven up coal consumption. In contrast, India’s power demand remained subdued during the monsoon season, and high inventory levels kept buying interest weak.
On the supply side, Indonesian production fundamentals remained stable. Since current prices are near production costs, Indonesian suppliers refused to lower their offers. With operating costs approaching break-even levels, miners stood firm and resisted selling at further discounts. On the other hand, weak demand kept buyers from raising their bids, resulting in a pricing standoff with no clear movement.
Atlantic Region:
In Europe, July marks peak summer electricity demand, driven by increased residential and industrial consumption. This heightened power sector demand for thermal coal, while inventories at major European ports remained relatively low. The resulting supply tightness pushed prices higher at the three main European ports.
Meanwhile, South Africa’s thermal coal market saw limited trading activity as most buyers stayed on the sidelines. In India, sponge iron prices hit historic lows, further weakening demand. The few Indian end-users still active in the market were attempting to strike deals at the lowest possible prices. As a result, South African thermal coal prices continued to decline.
·Coking Coal
In China, supply disruptions persisted in major producing regions.
In Shanxi’s Lüliang and Changzhi areas, some coal mines reduced or halted output due to underground issues or equipment replacement.
In Wuhai, Inner Mongolia, environmental inspections tightened again, limiting mine production and transport. Overall, the recovery on the supply side remained slow.
On the demand side, downstream coke plants moderately restocked cost-effective coal grades. Some traders also resumed procurement, with midstream activity improving. This boosted overall transaction volumes, helped coal mine sales, and led to rapid inventory drawdowns.
Online auctions frequently closed at higher prices, and some pithead offers increased slightly.
For Mongolian imports, cross-border customs clearance remained sluggish this week.
The Mongolian coal market showed strength, supported by rising futures prices, which encouraged procurement among both physical and paper traders. However, end-user acceptance of high prices remained limited, focusing instead on restocking as needed.
Port transactions of Mongolian coal remained active, and traders continued to hold firm on price, keeping offers at high levels.
Global end-users maintained rigid demand, while India showed signs of demand recovery—lifting overall sentiment in the international market.
Optimism in China also drove bullish expectations globally, with international traders becoming more aggressive in price outlooks.
Tenders from major Australian mines saw notable price increases in mid-week, confirming a rebound in Australian coking coal prices.
Price Summary (as of the week ending July 4):
Australian premium low-vol HCC (specs: Sulfur 0.5%, Ash 9.3%, Volatile Matter 21.5%, Moisture 9.7%, CSR 71%):
FOB Price: $182/ton, up $9 from the previous week (+5.2%)
China CFR Price: $159/ton, up $1.5 from the previous week (+0.95%)
Statistics
Indonesia
According to Bloomberg Technoz (Jakarta, July 2), Badan Pusat Statistik (Statistics Indonesia) reported that coal export value from January to May 2025 totaled USD 10.26 billion, down 19.1% from USD 12.68 billion in the same period of 2024.
Coal export volume (hard coal only) reached 156.37 million tons, down 7.62 million tons or 4.65% from 163.99 million tons a year earlier.
Pudji Ismartini from BPS, stated that
exports to China in the first five months of 2025 dropped 37.34% in volume and 19.39% in value year-on-year
exports to India fell 9.68% in volume and 21.64% in value
exports to Japan declined 22.68% in volume and 36.11% in value.
Japan
According to Japan’s Ministry of Finance, coal imports in May 2025 fell to 10.32 million tons, the lowest level since February 2000 — down 14.15% MoM and 9.21% YoY, a decrease of 1.70 million tons from April and 1.05 million tons from May 2024.
By coal type in May 2025:
Thermal coal: 5.7856 Mt, down 3.68% YoY and 22.22% MoM (fifth consecutive monthly decline); accounted for 56% of total imports.
Coking coal: 4.1787 Mt, down 18.34% YoY, 2.05% MoM; accounted for 40%.
Anthracite: 0.3595 Mt, up 45.08% YoY, 12.08% MoM; accounted for 3%.
Lignite: 0.0004 Mt, up 7.47% YoY, down 33.53% MoM.
Total Jan–May 2025 coal imports:
63.4099 million tons, down 4.12% YoY.
Turkey
According to the Turkish Statistical Institute (TUIK), Turkey imported 3.3456 million tons of coal in May 2025, up 2.66% YoY and 0.35% MoM, setting a new record for May.
May 2024: 3.2589 Mt
April 2025: 3.3341 Mt
By coal type in May 2025:
Bituminous coal: 2.7264 Mt, up 7.83% YoY, 1.93% MoM
Coking coal: 0.5809 Mt, down 11.4% YoY, up 11.98% MoM
Anthracite: 0.0386 Mt, down 48.6% YoY, down 70.97% MoM
Jan–May 2025 cumulative imports:
17.4633 million tons, up 6.73% YoY
Canada
According to Statistics Canada, in April 2025, Canada exported 3.2194 million tons of coal, up 17.04% YoY but down 6.11% MoM.
By destination in April:
China: 0.8723 Mt, up 39.73% YoY, down 4.76% MoM
South Korea: 0.8254 Mt, up 71.84% YoY, down 12.56% MoM
Japan: 0.5425 Mt, down 35.57% YoY, down 43.69% MoM
Jan–April 2025 cumulative exports:
12.1585 million tons, up 4.47% YoY
South Africa
South African customs data shows coal exports in May 2025 reached 6.4172 million tons, up 6.47% YoY and 1.71% MoM from April’s 6.3096 million tons and May 2024’s 6.0274 million tons.
RBCT Terminal (Richards Bay):
Exported 6.0142 Mt, up 11.06% YoY, 1.18% MoM, accounting for 93.7% of South Africa’s total coal exports in May.
Jan–May 2025 cumulative exports:
31.3931 million tons, up 5.67% YoY
RBCT contribution: 29.2019 Mt, up 10.84% YoY
By coal type in May 2025:
Bituminous coal: 6.0553 Mt, up 8% YoY, 3.3% MoM, accounted for 94.36% of total exports (vs. 92.82% in April)
Other coal: 0.3069 Mt, up 13.22% YoY, 23.76% MoM, 4.78% share
Anthracite: 0.055 Mt, down 63.17% YoY, up 21.11% MoM, 0.86% share
India
According to Coal India Ltd. (CIL), coal production in June 2025 was 57.80 million tons, down 8.4% YoY and 8.98% MoM.
June 2024: 63.10 Mt
May 2025: 63.50 Mt
Coal sales in June 2025:
60.40 million tons, down 7.36% YoY, 5.63% MoM
June 2024: 65.20 Mt
May 2025: 64.00 Mt
FY2025 Q1 (April–June):
Production: 183 Mt, down 3.17% YoY
Sales: 190 Mt, down 4.42% YoY
Australia
Australia’s resource export revenue is projected to decline over the next two years. According to a government report released on Monday, factors such as rising trade barriers, falling commodity prices, and a weakening global economy may lead to continued contraction in mining and energy exports.
FY2024–25 (July 2024–June 2025):
Forecast export earnings: AUD 385 billion (~USD 252 billion), down from AUD 415 billion in the previous fiscal year.
FY2025–26 & FY2026–27 Forecasts:
Revenue may decline further to AUD 369 billion and AUD 352 billion, respectively.
Resource Minister Madeleine King noted that rising gold prices, along with increased copper and lithium exports, may partially offset declines in iron ore, coal, and LNG prices. Following a recent sharp drop, lithium export earnings are expected to recover gradually from AUD 4.6 billion this fiscal year to over AUD 5.5 billion in the next

| Index | RMB/t | DoD | Basis | Date |
|---|---|---|---|---|
| Datong 5500 | ex-mine | 07-01 | ||
| Shuozhou 5200 | FOR | 07-01 | ||
| Ordos 5500 | ex-mine | 07-01 | ||
| Yulin 6200 | ex-mine | 07-01 | ||
| Liulin Low-sulphur | ex-mine | 07-01 | ||
| Gujiao Low-sulphur | FOR | 07-01 | ||
| Xingtai Low-sulphur | ex-Factory | 07-01 | ||
| Yangquan PCI | FOR | 07-01 |
| Index | RMB/t | WoW | WoW% | Date |
|---|---|---|---|---|


 褰檽锟斤拷?