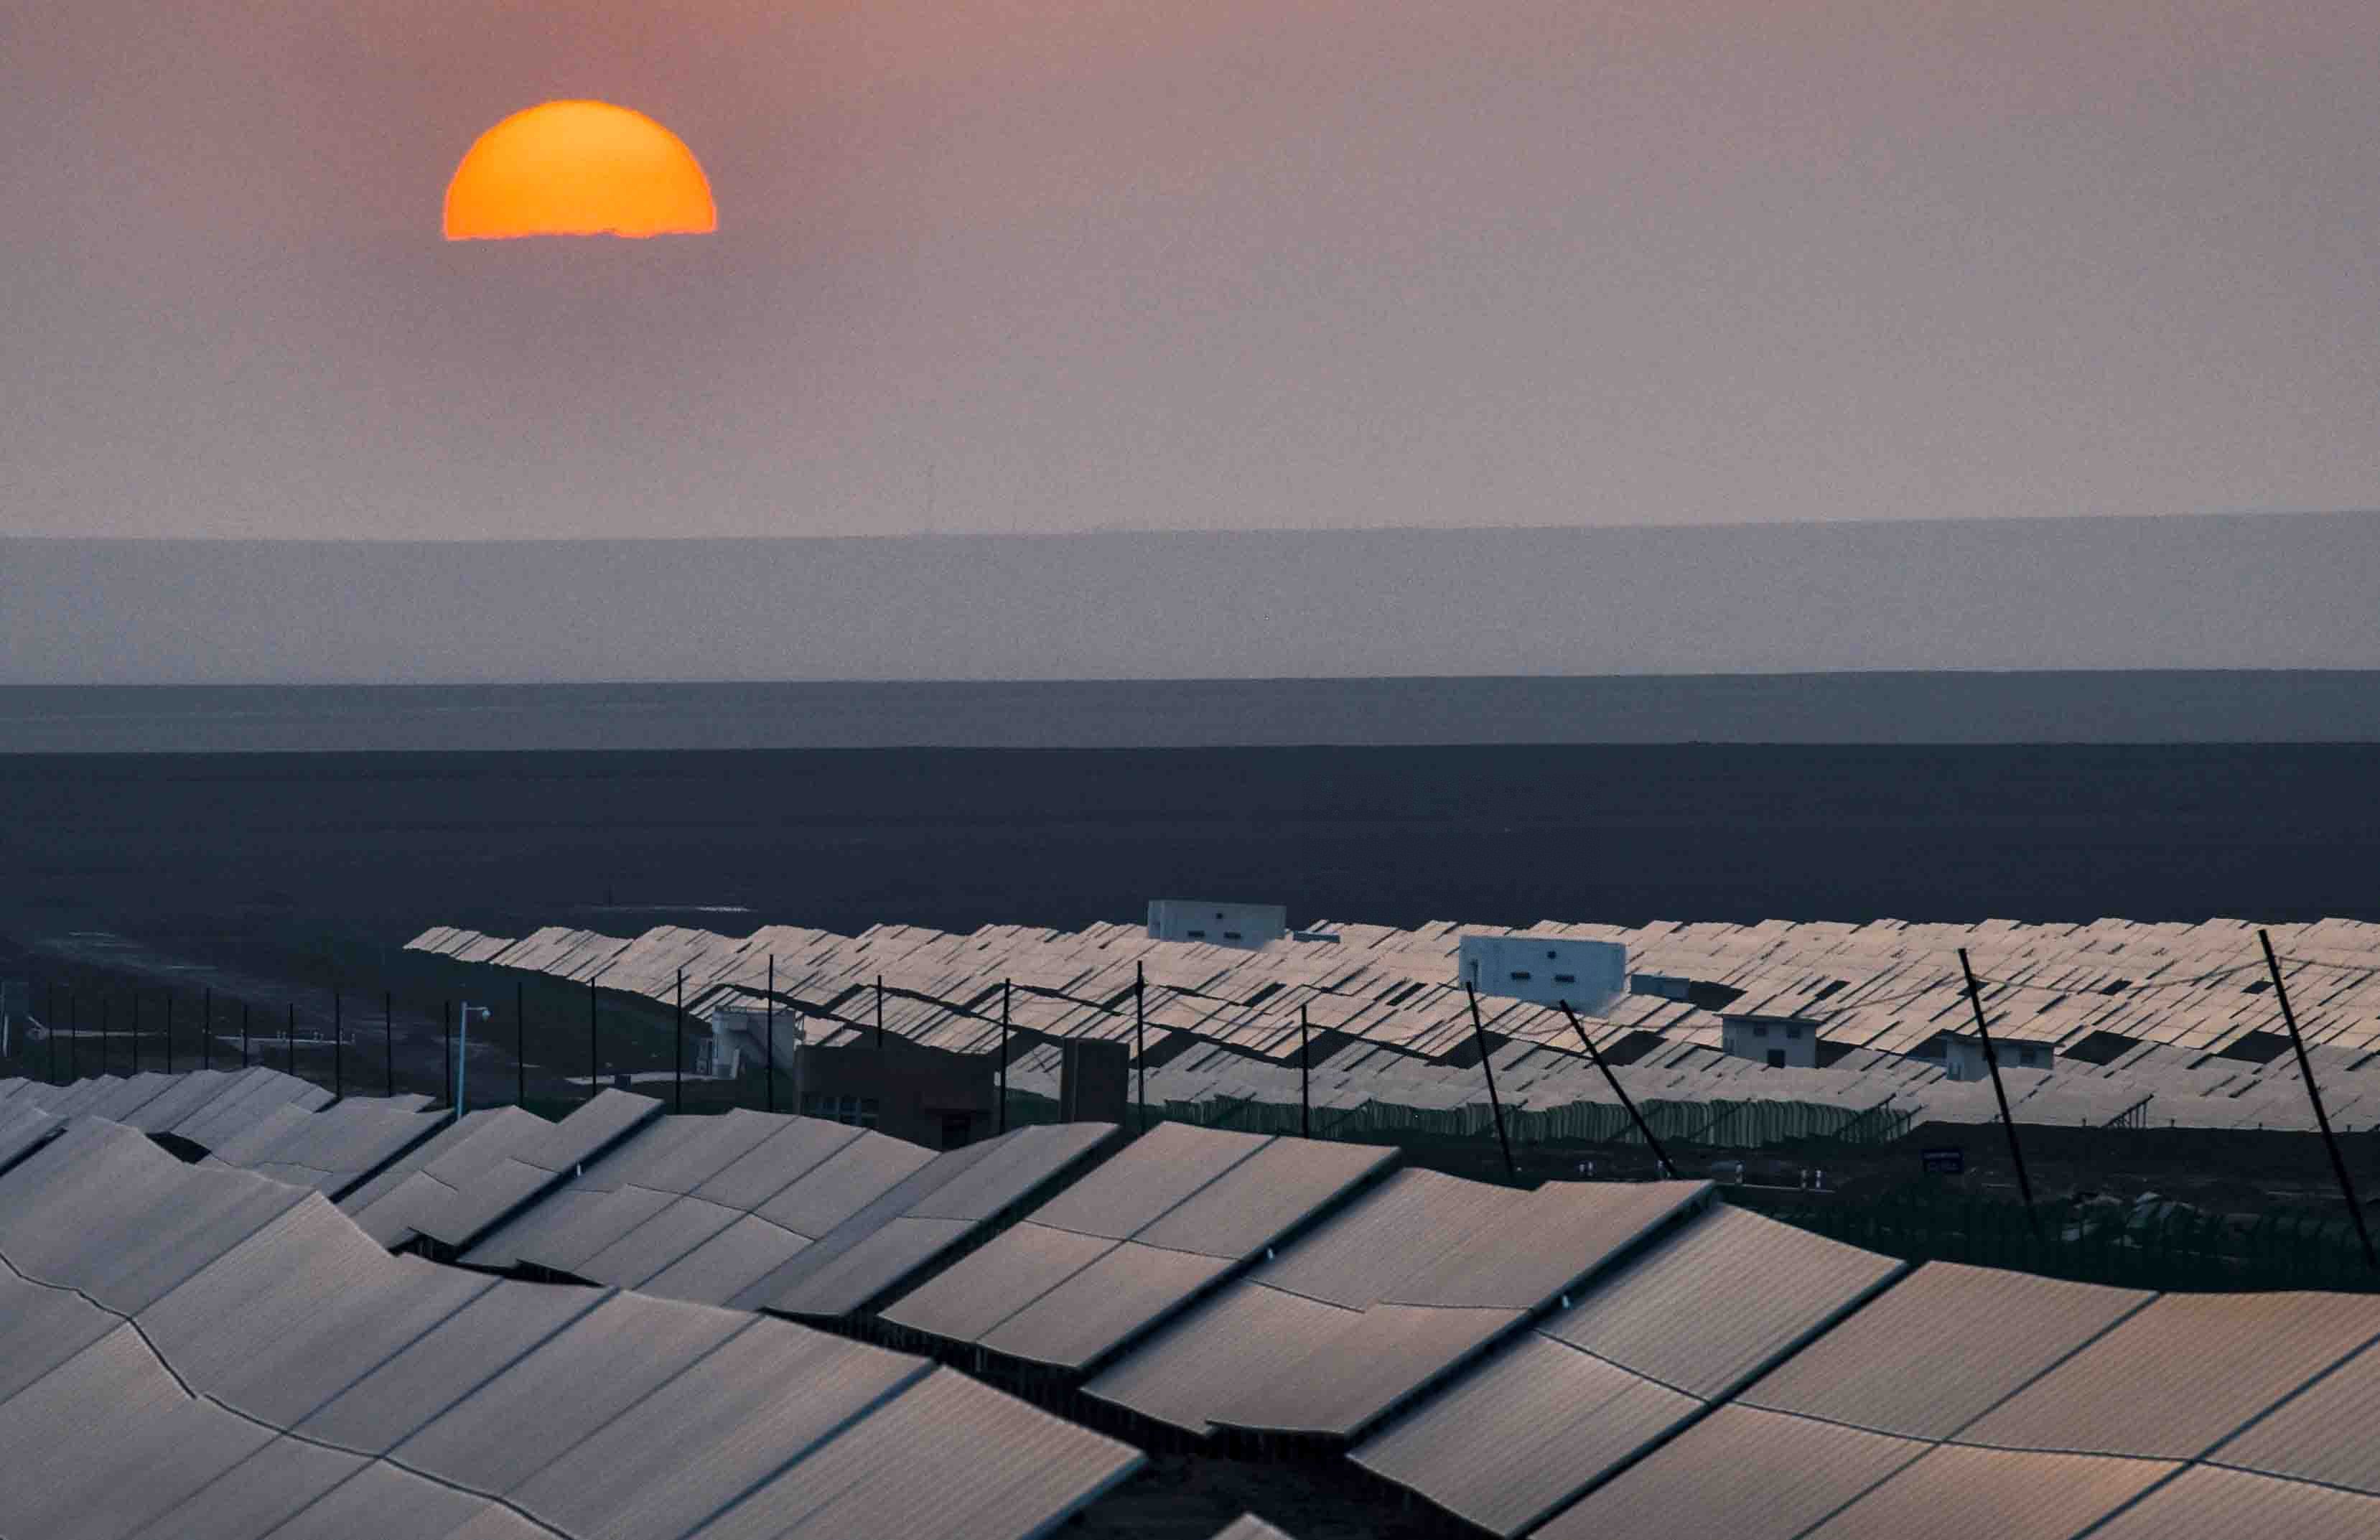
Photo taken on Sept. 18, 2018 shows a photovoltaic power plant in Turpan, northwest China's Xinjiang Uygur Autonomous Region.
China's energy consumption per unit of GDP continued to decrease in the first quarter of 2019.
The overall amount decreased 2.7 percent year on year and the rate of enterprises above designated scale went down 3.4 percent, said National Bureau of Statistics (NBS). Industrial companies with an annual prime operating revenue no less than 20 million yuan (about 2.97 million U.S. dollars) are counted as enterprises above designated scale.
China's demand and supply saw sustaining improvement in structure in Q1, said Liu Wenhua, an energy official of NBS.
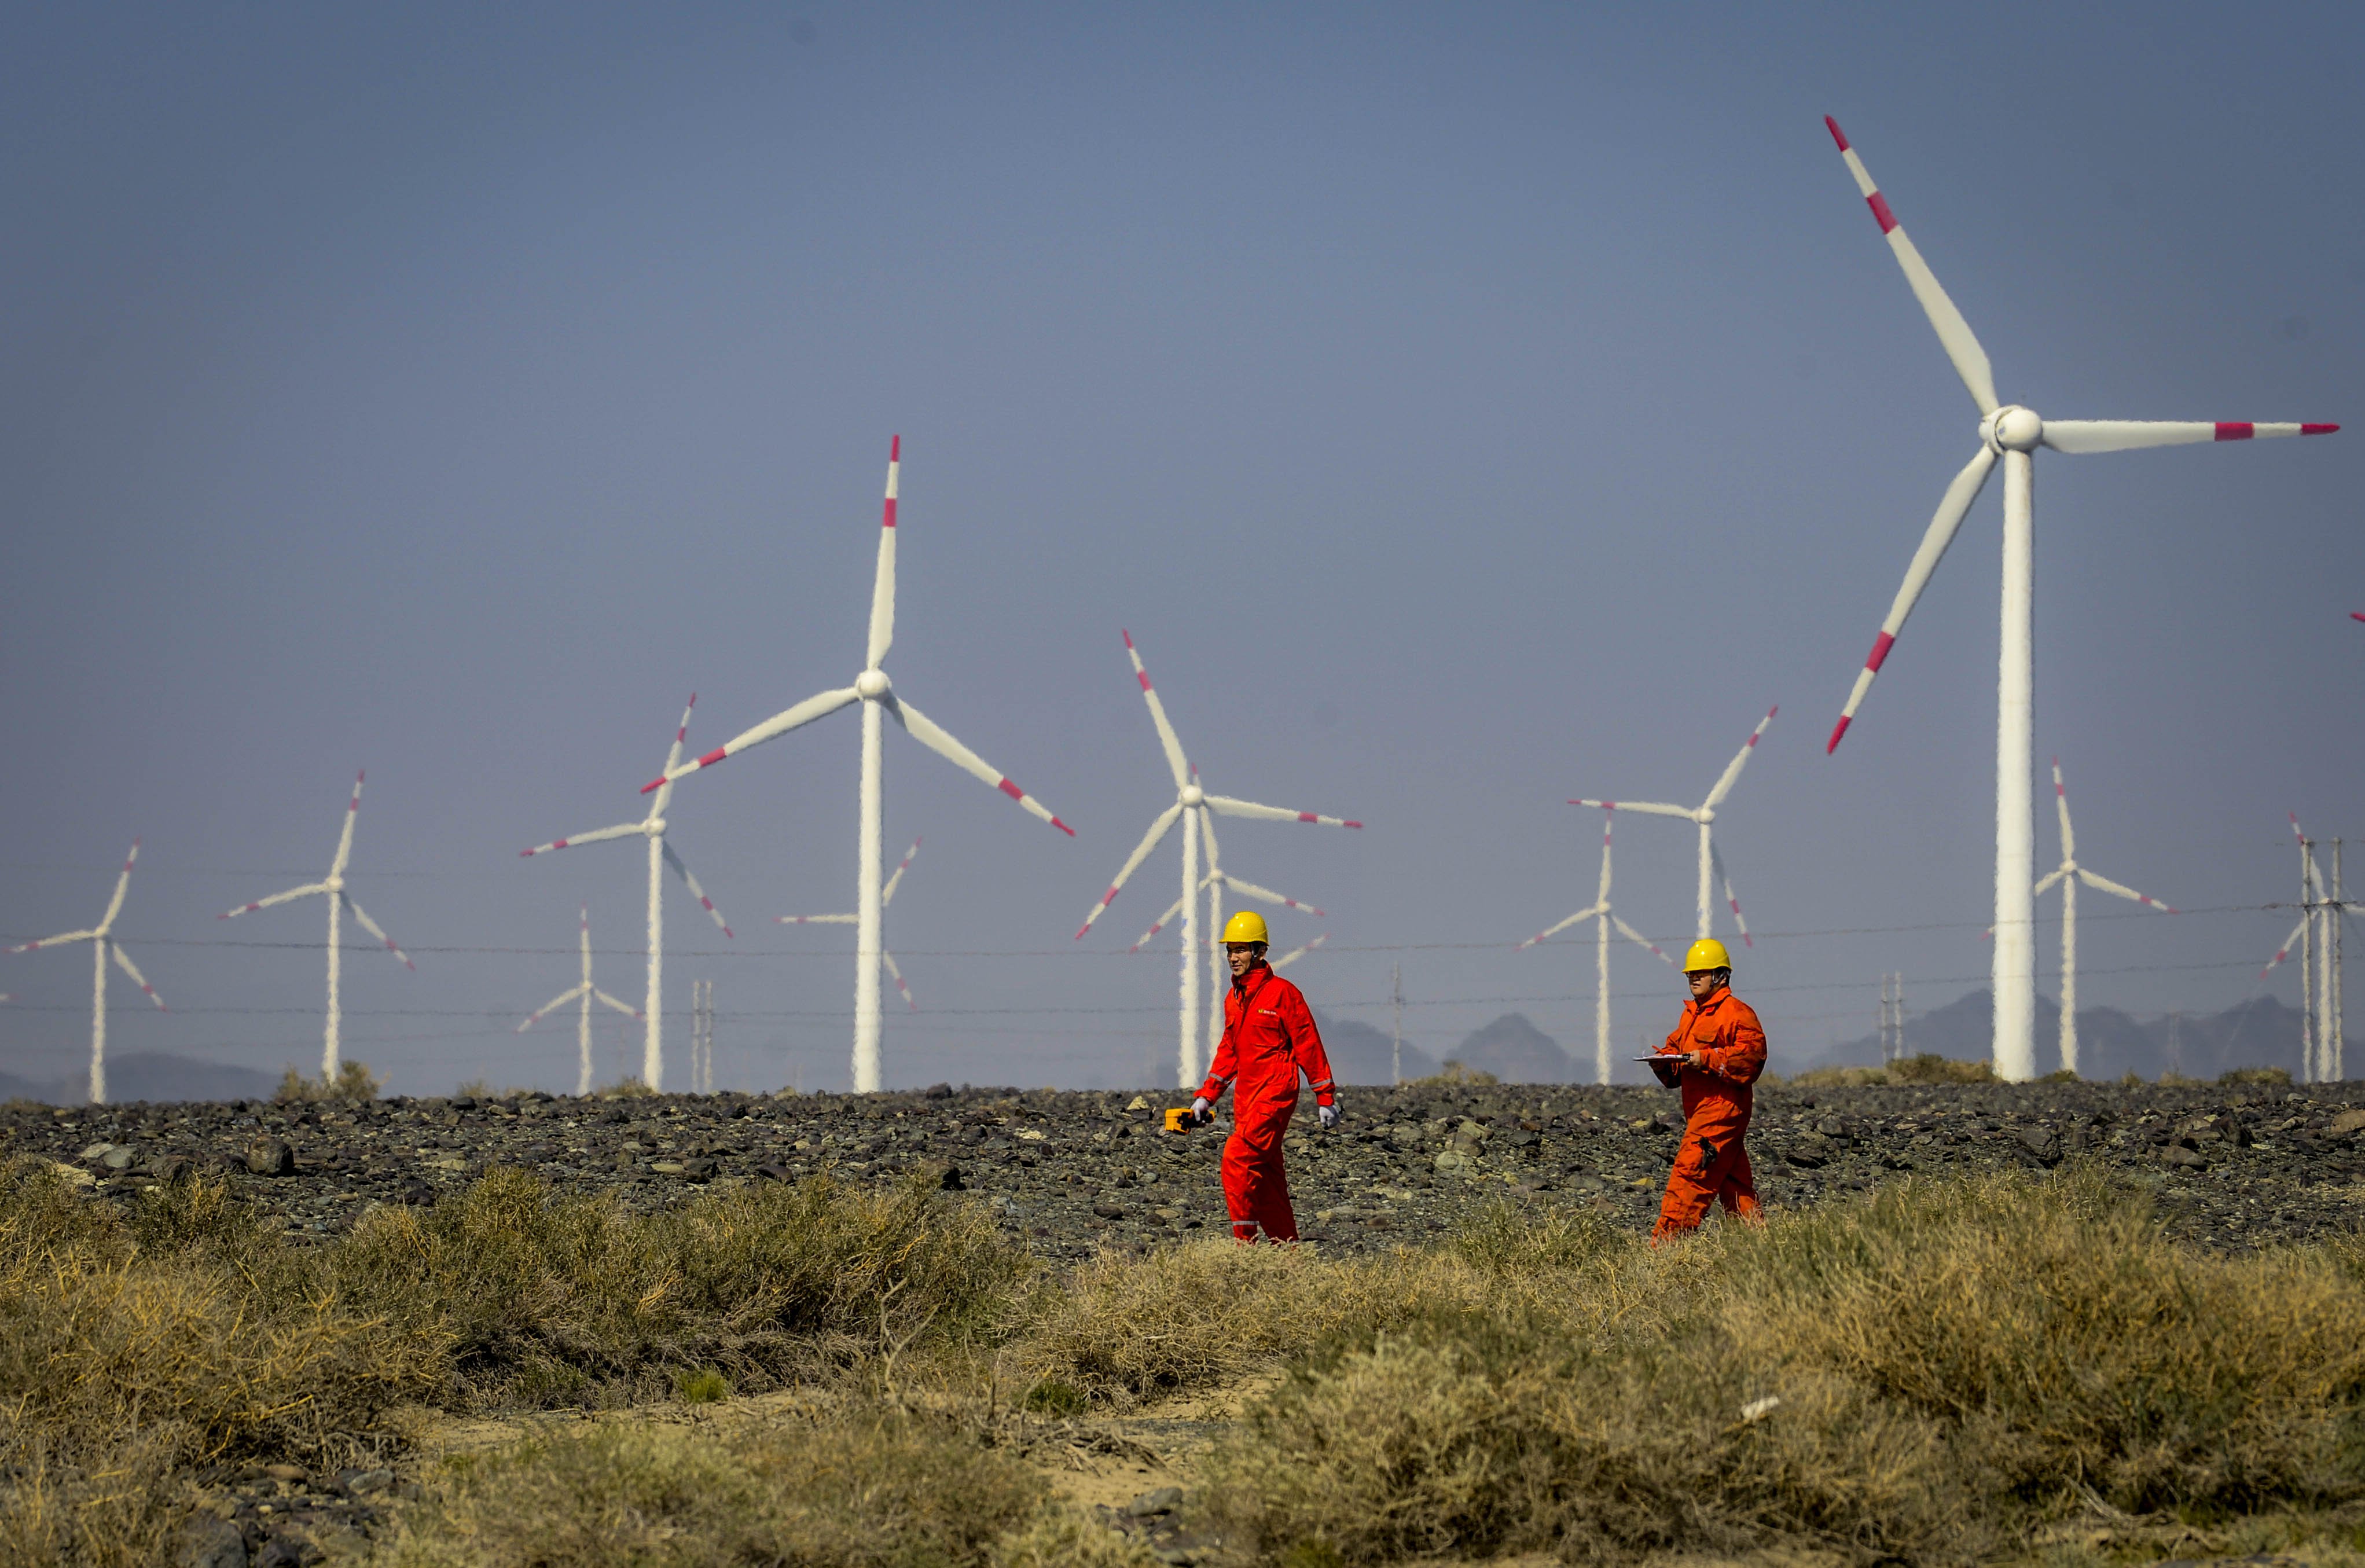
Workers check equipment at a wind power plant in Urumqi, northwest China's Xinjiang Uygur Autonomous Region, Sept. 18, 2018.
Compared to the same period last year, share of clean energy including natural gas, wind, hydropower and nuclear energy in China's total energy consumption went up 1.5 percentage points, while the proportion of coal consumption decreased 1.8 percentage points.
According to the initial estimate of NBS, energy consumption nationwide rose 3.5 percent year on year in the first three months.


 褰檽锟斤拷?