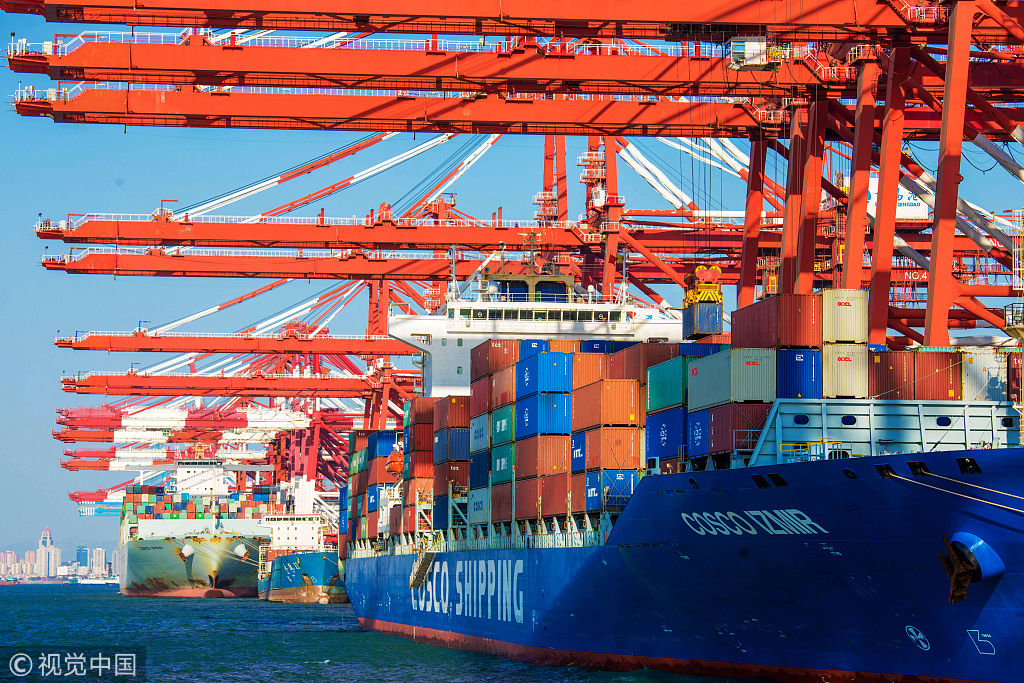
Containers carrying goods for export are seen in Qingdao Port, East China's Shandong province, on Oct 19, 2018.
China's cargo throughput at ports climbed 8.3 percent year-on-year to 12.7 billion tons in the first 11 months, official data showed.
Foreign trade cargo throughput amounted to 3.96 billion tons in the January-November period, up 4.7 percent year-on-year.
Meanwhile, container throughput at ports registered a 4.5-percent increase to around 239.5 million TEUs (20-foot equivalent units) in the same period.
At the beginning of the year, the Ministry of Transport expanded the statistical range from major ports to all ports across the country.
The cargo throughput growth at ports came amid the steady expansion of China's waterway freight volume, which increased 6.3 percent year-on-year to 6.8 billion tons in the first 11 months.

| Index | RMB/t | DoD | Basis | Date |
|---|---|---|---|---|
| Datong 5500 | 700 | 0 | ex-mine | 05-04 |
| Shuozhou 5200 | 680 | 0 | FOR | 05-04 |
| Ordos 5500 | 700 | 0 | ex-mine | 05-04 |
| Yulin 6200 | 780 | 0 | ex-mine | 05-04 |
| Liulin Low-sulphur | 900 | 0 | ex-mine | 05-04 |
| Gujiao Low-sulphur | 1770 | -50 | FOR | 05-04 |
| Xingtai Low-sulphur | 2360 | 0 | ex-Factory | 05-04 |
| Yangquan PCI | 1280 | -30 | FOR | 05-04 |
| Index | RMB/t | WoW | WoW% | Date |
|---|---|---|---|---|
| Qinhuangdao | 507.0 | 1.0 | 0.20 | 05-04 |
| Caofeidian | 541.0 | 9.0 | 1.69 | 05-04 |
| Huanghua | 216.9 | 12.4 | 6.06 | 05-04 |
| Guangzhou | 291.2 | 3.0 | 1.04 | 04-27 |
| coastal 6PPs | 1629.8 | 44.7 | 2.82 | 07-02 |
| North Ports | 2697.8 | 53.0 | 2.00 | 02-01 |
| Yangtze River delta | 1242.5 | -74.7 | -5.67 | 02-01 |
| South Ports | 2233.4 | -216.0 | -8.82 | 02-01 |


 褰檽锟斤拷?